Reading water connect observations
This notebook introduces how to use the hydropandas package to read, process and visualise data from the South Australia Water Connect database.
[1]:
import contextily as cx
import matplotlib.pyplot as plt
import numpy as np

import hydropandas as hpd
from hydropandas.io.water_connect import get_locations_gdf, get_locations_within_extent

# enabling logging so we can see what happens in the background
hpd.util.get_color_logger("INFO");
[2]:
# get water connect observations within an extent
extent = (
    140.86,
    140.9,
    -38.05,
    -38.00,
)  # (left, right, lower, upper) bounds in lat/lon
oc = hpd.read_waterconnect(extent=extent, tmin="2000-1-1")
oc
INFO:hydropandas.io.water_connect.get_locations_gdf:Initializing Water Connect, this may take several minutes. This only has to be done the first time you use Water Connect via hydropandas.
INFO:hydropandas.io.water_connect.get_obs_list_from_extent:downloading waterconnect data from 62 observation points
obs well: 100%|██████████| 62/62 [00:49<00:00, 1.26it/s]
[2]:
| x | y | location | filename | source | unit | tube_nr | screen_top | screen_bottom | ground_level | tube_top | metadata_available | obs | |
|---|---|---|---|---|---|---|---|---|---|---|---|---|---|
| name | |||||||||||||
| 105146 | 140.877410 | -38.017369 | 702101091 | DEWNR (water connect) | m AHD | NaN | NaN | 13.01 | NaN | NaN | GroundwaterObs 105146 -----metadata------ name... | ||
| 105147 | 140.887695 | -38.015521 | 702101092 | DEWNR, DEW (water connect) | m AHD | NaN | NaN | 12.92 | NaN | NaN | GroundwaterObs 105147 -----metadata------ name... | ||
| 105306 | 140.871336 | -38.018425 | 702101251 | DEWNR (water connect) | m AHD | NaN | NaN | 12.99 | NaN | NaN | GroundwaterObs 105306 -----metadata------ name... | ||
| 105319 | 140.897937 | -38.018118 | 702101264 | DEWNR (water connect) | m AHD | NaN | NaN | 13.29 | NaN | NaN | GroundwaterObs 105319 -----metadata------ name... | ||
| 187285 | 140.891788 | -38.010617 | 702103385 | DEWNR (water connect) | m AHD | NaN | NaN | 12.22 | NaN | NaN | GroundwaterObs 187285 -----metadata------ name... | ||
| 187286 | 140.885841 | -38.010855 | 702103386 | DEWNR (water connect) | m AHD | NaN | NaN | 11.77 | NaN | NaN | GroundwaterObs 187286 -----metadata------ name... | ||
| 196601 | 140.877825 | -38.008414 | 702103412 | DEWNR (water connect) | m AHD | NaN | NaN | 11.80 | NaN | NaN | GroundwaterObs 196601 -----metadata------ name... | ||
| 232794 | 140.861240 | -38.032324 | 702103471 | DEWNR (water connect) | m AHD | NaN | NaN | 11.09 | NaN | NaN | GroundwaterObs 232794 -----metadata------ name... | ||
| 235416 | 140.861229 | -38.032504 | 702103480 | DEWNR (water connect) | m AHD | NaN | NaN | 10.82 | NaN | NaN | GroundwaterObs 235416 -----metadata------ name... | ||
| 253247 | 140.876240 | -38.032026 | 702103526 | DEWNR, DEW (water connect) | m AHD | NaN | NaN | 7.12 | NaN | NaN | GroundwaterObs 253247 -----metadata------ name... | ||
| 253806 | 140.867643 | -38.045536 | 702103539 | DEWNR (water connect) | m AHD | NaN | NaN | 6.02 | NaN | NaN | GroundwaterObs 253806 -----metadata------ name... | ||
| 254397 | 140.882558 | -38.004894 | 702103542 | DEWNR (water connect) | m AHD | NaN | NaN | 11.41 | NaN | NaN | GroundwaterObs 254397 -----metadata------ name... | ||
| 303972 | 140.886134 | -38.005655 | 702103639 | DEWNR (water connect) | m AHD | NaN | NaN | 11.58 | NaN | NaN | GroundwaterObs 303972 -----metadata------ name... | ||
| 314551 | 140.890507 | -38.028777 | 702103656 | DEWNR (water connect) | m AHD | NaN | NaN | 27.12 | NaN | NaN | GroundwaterObs 314551 -----metadata------ name... | ||
| 387793 | 140.866117 | -38.013664 | 702103725 | DEWNR (water connect) | m AHD | NaN | NaN | -9999.00 | NaN | NaN | GroundwaterObs 387793 -----metadata------ name... | ||
| 391456 | 140.879714 | -38.032349 | 702103731 | DEWNR, DEW (water connect) | m AHD | NaN | NaN | 7.39 | NaN | NaN | GroundwaterObs 391456 -----metadata------ name... | ||
| 391457 | 140.899277 | -38.004013 | 702103732 | DEW (water connect) | m AHD | NaN | NaN | 21.07 | NaN | NaN | GroundwaterObs 391457 -----metadata------ name... | ||
| 391458 | 140.897543 | -38.014105 | 702103733 | DEW (water connect) | m AHD | NaN | NaN | 13.43 | NaN | NaN | GroundwaterObs 391458 -----metadata------ name... |
[3]:
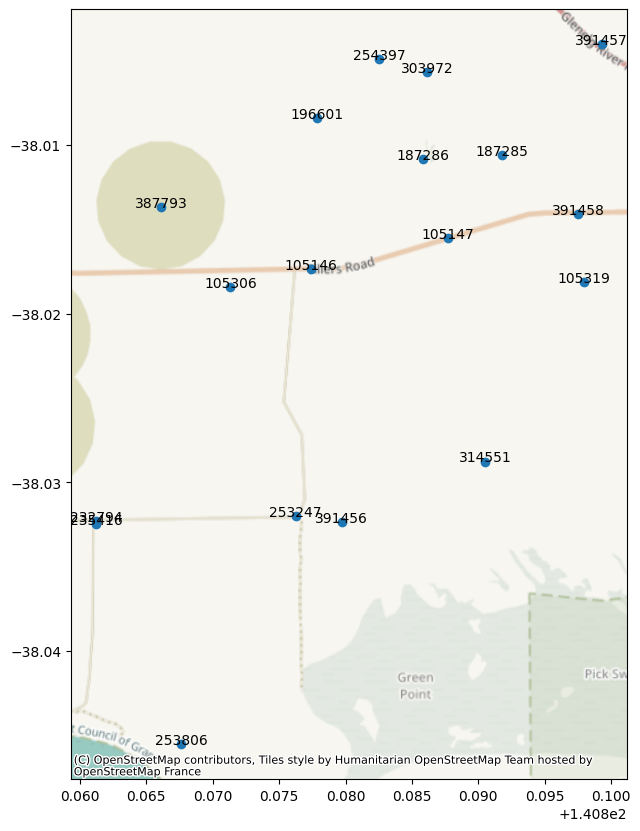
# plot locations on map
ax = oc.to_gdf(crs=4326).plot(
    figsize=(10, 10),
)
cx.add_basemap(ax=ax, crs=4326)

# add labels
for idx, row in oc.iterrows():
    ax.annotate(text=idx, xy=(row["x"], row["y"]), horizontalalignment="center")
[4]:
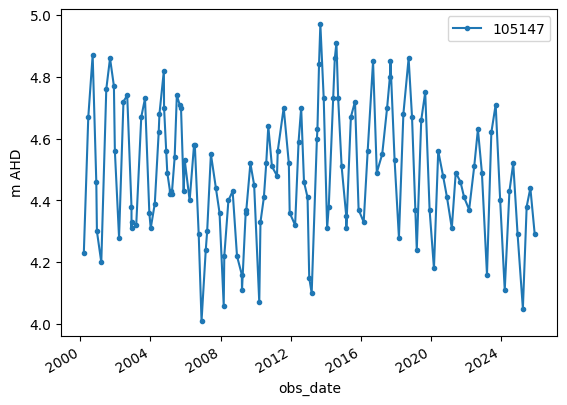
# plot measurements from a single observation
o = oc.get_obs(105147)
o["rswl"].plot(marker=".", label=o.name, ylabel=o.unit, legend=True)
[4]:
<Axes: xlabel='obs_date', ylabel='m AHD'>
[5]:
# get data from a certain measurement well based on the drillhole number (dh_no)
o1 = hpd.GroundwaterObs.from_waterconnect(95360)
o1
[5]:
hydropandas.GroundwaterObs
| 95360 | |
|---|---|
| x | 140.411598 |
| y | -36.841521 |
| location | 692400271 |
| filename | |
| source | DEWNR, DEW (water connect) |
| unit | m AHD |
| tube_nr | |
| screen_top | NaN |
| screen_bottom | NaN |
| ground_level | 41.73 |
| tube_top | NaN |
| metadata_available | NaN |
| rswl | DHNO | network | Unit_Number | Aquifer | Easting | Northing | Zone | Unit_No | Obs_No | ... | swl | pressure | temperature | artesian_ind | dry_ind | anom_ind | pump_ind | measured_during | data_source | Comments | |
|---|---|---|---|---|---|---|---|---|---|---|---|---|---|---|---|---|---|---|---|---|---|
| obs_date | |||||||||||||||||||||
| 1971-06-10 | 31.83 | 95360 | LLC_NTH | 692400271 | Qpcb | 447537.57 | 5922546.51 | 54 | 6924-271 | WLM010 | ... | 9.91 | NaN | NaN | N | NaN | N | N | M | DEWNR | NaN |
| 1971-06-22 | 32.33 | 95360 | LLC_NTH | 692400271 | Qpcb | 447537.57 | 5922546.51 | 54 | 6924-271 | WLM010 | ... | 9.41 | NaN | NaN | N | NaN | N | N | U | DEWNR | NaN |
| 1971-08-31 | 31.75 | 95360 | LLC_NTH | 692400271 | Qpcb | 447537.57 | 5922546.51 | 54 | 6924-271 | WLM010 | ... | 9.99 | NaN | NaN | N | NaN | N | N | M | DEWNR | NaN |
| 1972-01-12 | 31.71 | 95360 | LLC_NTH | 692400271 | Qpcb | 447537.57 | 5922546.51 | 54 | 6924-271 | WLM010 | ... | 10.03 | NaN | NaN | N | NaN | N | N | M | DEWNR | NaN |
| 1972-03-19 | 31.44 | 95360 | LLC_NTH | 692400271 | Qpcb | 447537.57 | 5922546.51 | 54 | 6924-271 | WLM010 | ... | 10.30 | NaN | NaN | N | NaN | N | N | M | DEWNR | NaN |
| ... | ... | ... | ... | ... | ... | ... | ... | ... | ... | ... | ... | ... | ... | ... | ... | ... | ... | ... | ... | ... | ... |
| 2023-09-22 | 30.94 | 95360 | LLC_NTH | 692400271 | Qpcb | 447537.57 | 5922546.51 | 54 | 6924-271 | WLM010 | ... | 10.80 | NaN | NaN | NaN | NaN | N | N | M | DEW | NaN |
| 2024-03-13 | 30.34 | 95360 | LLC_NTH | 692400271 | Qpcb | 447537.57 | 5922546.51 | 54 | 6924-271 | WLM010 | ... | 11.40 | NaN | NaN | NaN | NaN | N | N | M | DEW | NaN |
| 2024-09-10 | 30.18 | 95360 | LLC_NTH | 692400271 | Qpcb | 447537.57 | 5922546.51 | 54 | 6924-271 | WLM010 | ... | 11.56 | NaN | NaN | NaN | NaN | N | N | M | DEW | NaN |
| 2025-03-18 | 29.88 | 95360 | LLC_NTH | 692400271 | Qpcb | 447537.57 | 5922546.51 | 54 | 6924-271 | WLM010 | ... | 11.86 | NaN | NaN | NaN | NaN | N | N | M | DEW | NaN |
| 2025-09-10 | 30.12 | 95360 | LLC_NTH | 692400271 | Qpcb | 447537.57 | 5922546.51 | 54 | 6924-271 | WLM010 | ... | 11.62 | NaN | NaN | NaN | NaN | N | N | M | DEW | NaN |
211 rows × 21 columns
[6]:
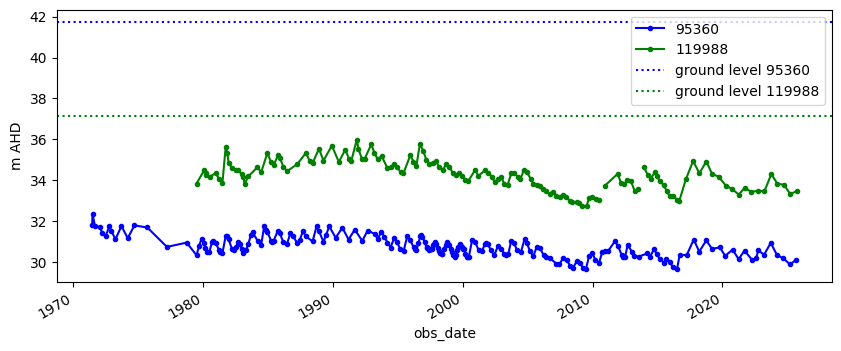
# get water levels from another drillhole and plot both
o2 = hpd.GroundwaterObs.from_waterconnect(119988)

# plot data
f, ax = plt.subplots(figsize=(10, 4))
o1["rswl"].plot(ylabel=o1.unit, label=o1.name, marker=".", color="b", ax=ax)
o2["rswl"].plot(ylabel=o2.unit, label=o2.name, marker=".", ax=ax, color="g")
ax.axhline(o1.ground_level, ls=":", color="b", label=f"ground level {o1.name}")
ax.axhline(o2.ground_level, ls=":", color="g", label=f"ground level {o2.name}")
ax.legend()
[6]:
<matplotlib.legend.Legend at 0x7bdff55d0290>
Find selection criteria
Very often you don’t know exactly the drillhole numbers (dh_no) of the measurements you want to download and it may be unfeasable to download all the observations in the extent. To get the data that you want you can follow these steps:
get a geodataframe with the metadata of all the locations in the extent
query the geodataframe by any metadata property such as REF_ELEV, STATUS, MAX_DEPTH
request the measurement for the locations you obtained at step 2
[7]:
# step 1
extent = (
    140.86,
    140.9,
    -38.05,
    -38.00,
)  # (left, right, lower, upper) bounds in lat/lon

# get all locations
gdf = get_locations_gdf()
gdf_extent = get_locations_within_extent(gdf, extent)
gdf_extent
[7]:
| UNIT_NO | NAME | EASTING | NORTHING | ZONE | LAT | LON | REF_ELEV | GRND_ELEV | HUND | ... | TITLE_PREF | TITLE_VOLU | TITLE_FOLI | TITLE_ID | GRND_ELEV_ | HGUID | FTYPE | NGIS | LATEST_REF | geometry | |
|---|---|---|---|---|---|---|---|---|---|---|---|---|---|---|---|---|---|---|---|---|---|
| DHNO | |||||||||||||||||||||
| 105107 | 702101052 | None | 487754.44 | 5793936.86 | 54 | -38.002154 | 140.860521 | 17.108 | 17.10 | None | ... | CT | 5410 | 833 | CT5410/833 | 21.912327 | 0 | None | None | None | POINT (140.86052 -38.00215) |
| 105108 | 702101053 | None | 490937.36 | 5793850.92 | 54 | -38.002966 | 140.896774 | -9999.000 | 23.05 | None | ... | CT | 5930 | 28 | CT5930/28 | 23.581266 | 0 | None | None | None | POINT (140.89677 -38.00297) |
| 105146 | 702101091 | None | 489239.43 | 5792250.81 | 54 | -38.017369 | 140.877410 | -9999.000 | 13.01 | None | ... | None | None | None | None | 15.000000 | 0 | None | None | None | POINT (140.87741 -38.01737) |
| 105147 | 702101092 | None | 490142.00 | 5792457.00 | 54 | -38.015521 | 140.887695 | 13.759 | 12.92 | None | ... | CT | 5844 | 352 | CT5844/352 | 15.086025 | 0 | None | None | None | POINT (140.88769 -38.01552) |
| 105148 | 702101093 | None | 490193.38 | 5792402.91 | 54 | -38.016009 | 140.888280 | 13.460 | 13.19 | None | ... | CT | 5460 | 747 | CT5460/747 | 18.047085 | 0 | None | None | None | POINT (140.88828 -38.01601) |
| ... | ... | ... | ... | ... | ... | ... | ... | ... | ... | ... | ... | ... | ... | ... | ... | ... | ... | ... | ... | ... | ... |
| 314551 | 702103656 | None | 490390.58 | 5790986.50 | 54 | -38.028777 | 140.890507 | -9999.000 | 27.12 | None | ... | CT | 6012 | 332 | CT6012/332 | 27.664576 | 0 | None | None | None | POINT (140.89051 -38.02878) |
| 387793 | 702103725 | None | 488247.57 | 5792660.48 | 54 | -38.013664 | 140.866117 | -9999.000 | -9999.00 | None | ... | CT | 5936 | 493 | CT5936/493 | 13.339000 | 0 | None | None | None | POINT (140.86612 -38.01366) |
| 391456 | 702103731 | None | 489443.83 | 5790588.91 | 54 | -38.032349 | 140.879714 | 8.141 | 7.39 | None | ... | CT | 6012 | 333 | CT6012/333 | 7.243739 | 0 | None | None | None | POINT (140.87971 -38.03235) |
| 391457 | 702103732 | None | 491157.23 | 5793735.00 | 54 | -38.004013 | 140.899277 | 21.717 | 21.07 | None | ... | None | None | None | None | 25.439241 | 0 | None | None | None | POINT (140.89928 -38.00401) |
| 391458 | 702103733 | None | 491006.30 | 5792614.99 | 54 | -38.014105 | 140.897543 | 14.245 | 13.43 | None | ... | CT | 5460 | 748 | CT5460/748 | 15.673721 | 0 | None | None | None | POINT (140.89754 -38.01411) |
62 rows × 81 columns
[8]:
# 2 query the GeoDataFrame

# print statistics of the reference elevation
gdf_extent.loc[gdf_extent["REF_ELEV"] == -9999, "REF_ELEV"] = np.nan
print(f"statistics of the reference elevation:\n{gdf_extent['REF_ELEV'].describe()}\n")

# print unique names
print(f"unique value in status column:\n {gdf_extent['STAT_DESC'].unique()}\n")

# print statistics of the maximum depth
gdf_extent.loc[gdf_extent["MAX_DEPTH"] == -9999, "MAX_DEPTH"] = np.nan
print(f"statistics of the max depth:\n{gdf_extent['MAX_DEPTH'].describe()}\n")

# select all observation points with some conditions
gdf_selection = gdf_extent.loc[
    (gdf_extent["REF_ELEV"] > 12.5) & (gdf_extent["MAX_DEPTH"] > 15)
]
print("selected data:\n")
display(gdf_selection)
statistics of the reference elevation:
count    11.000000
mean     12.486364
std       4.364845
min       7.025000
25%       9.480500
50%      12.000000
75%      14.002000
max      21.717000
Name: REF_ELEV, dtype: float64

unique value in status column:
 [None 'Operational' 'Abandoned' 'Unequipped' 'Not Located' 'Blocked'
 'Backfilled']

statistics of the max depth:
count     61.000000
mean      68.838525
std      102.366295
min        0.100000
25%       15.500000
50%       24.000000
75%       56.000000
max      483.000000
Name: MAX_DEPTH, dtype: float64

selected data:
| UNIT_NO | NAME | EASTING | NORTHING | ZONE | LAT | LON | REF_ELEV | GRND_ELEV | HUND | ... | TITLE_PREF | TITLE_VOLU | TITLE_FOLI | TITLE_ID | GRND_ELEV_ | HGUID | FTYPE | NGIS | LATEST_REF | geometry | |
|---|---|---|---|---|---|---|---|---|---|---|---|---|---|---|---|---|---|---|---|---|---|
| DHNO | |||||||||||||||||||||
| 105107 | 702101052 | None | 487754.44 | 5793936.86 | 54 | -38.002154 | 140.860521 | 17.108 | 17.10 | None | ... | CT | 5410 | 833 | CT5410/833 | 21.912327 | 0 | None | None | None | POINT (140.86052 -38.00215) |
| 105147 | 702101092 | None | 490142.00 | 5792457.00 | 54 | -38.015521 | 140.887695 | 13.759 | 12.92 | None | ... | CT | 5844 | 352 | CT5844/352 | 15.086025 | 0 | None | None | None | POINT (140.88769 -38.01552) |
| 391457 | 702103732 | None | 491157.23 | 5793735.00 | 54 | -38.004013 | 140.899277 | 21.717 | 21.07 | None | ... | None | None | None | None | 25.439241 | 0 | None | None | None | POINT (140.89928 -38.00401) |
| 391458 | 702103733 | None | 491006.30 | 5792614.99 | 54 | -38.014105 | 140.897543 | 14.245 | 13.43 | None | ... | CT | 5460 | 748 | CT5460/748 | 15.673721 | 0 | None | None | None | POINT (140.89754 -38.01411) |
4 rows × 81 columns
[9]:
# 3 read data for selection criteria
oc = hpd.read_waterconnect(location_gdf=gdf_selection)
oc
INFO:hydropandas.io.water_connect.get_obs_list_from_extent:downloading waterconnect data from 4 observation points
obs well: 100%|██████████| 4/4 [00:03<00:00, 1.18it/s]
[9]:
| x | y | location | filename | source | unit | tube_nr | screen_top | screen_bottom | ground_level | tube_top | metadata_available | obs | |
|---|---|---|---|---|---|---|---|---|---|---|---|---|---|
| name | |||||||||||||
| 105107 | 140.860521 | -38.002154 | 702101052 | DEWNR (water connect) | m AHD | NaN | NaN | 17.10 | NaN | NaN | GroundwaterObs 105107 -----metadata------ name... | ||
| 105147 | 140.887695 | -38.015521 | 702101092 | DEWNR, DEW (water connect) | m AHD | NaN | NaN | 12.92 | NaN | NaN | GroundwaterObs 105147 -----metadata------ name... | ||
| 391457 | 140.899277 | -38.004013 | 702103732 | DEW (water connect) | m AHD | NaN | NaN | 21.07 | NaN | NaN | GroundwaterObs 391457 -----metadata------ name... | ||
| 391458 | 140.897543 | -38.014105 | 702103733 | DEW (water connect) | m AHD | NaN | NaN | 13.43 | NaN | NaN | GroundwaterObs 391458 -----metadata------ name... |
[10]:
# plot the data on an interactive map
oc["lat"] = oc["y"]
oc["lon"] = oc["x"]
oc.plots.interactive_map(popup_width=350)
ERROR:hydropandas.extensions.plots.interactive_plots:391457 has no data between None and None
INFO:hydropandas.extensions.plots.interactive_map:no iplot available for 391457
[10]:
Make this Notebook Trusted to load map: File -> Trust Notebook