Reading waterinfo observations
This notebook introduces how to use the hydropandas package to read, process and visualise data from the Waterinfo database. In this notebook the ddlpy package (https://github.com/Deltares/ddlpy) is used to access the waterinfo api. This package can be installed using pip install rws-ddlpy.
[1]:
import contextily as ctx
import pandas as pd

import hydropandas as hpd
from hydropandas.io.waterinfo import get_locations_gdf

# enabling debug logging so we can see what happens in the background
hpd.util.get_color_logger("INFO");
[2]:
# settings
grootheid_code = None
locatie = "schoonhoven"
proces_type = "meting"
tmin = pd.Timestamp("2020-1-1")
tmax = pd.Timestamp("2020-1-3")
extent = (110000, 125000, 429550, 449900)  # Schoonhoven
[3]:
# get waterinfo observations within an extent
oc = hpd.read_waterinfo(
    extent=extent,
    grootheid_code=grootheid_code,
    proces_type=proces_type,
    locatie=locatie,
    tmin=tmin,
    tmax=tmax,
    keep_all_obs=False,
)
oc
INFO:ddlpy.ddlpy.retrieve_or_load_catalog:Retrieving Waterwebservices catalog, this can take 30 seconds
INFO:hydropandas.io.waterinfo.get_obs_list_from_extent:downloading waterinfo measurements from 12 observation points
100%|██████████| 1/1 [00:00<00:00, 2.02it/s]
INFO:hydropandas.io.waterinfo.get_measurements_ddlpy:No measurements for locatie='schoonhoven', grootheid_code='LAAGWTDG', groepering_code='', parameter_code='NVT' and proces_type='meting' between 2020-01-01 00:00:00 and 2020-01-03 00:00:00
100%|██████████| 1/1 [00:00<00:00, 2.04it/s]
INFO:hydropandas.io.waterinfo.get_measurements_ddlpy:No measurements for locatie='schoonhoven', grootheid_code='90%_L', groepering_code='LEVDHD5', parameter_code='NVT' and proces_type='meting' between 2020-01-01 00:00:00 and 2020-01-03 00:00:00
100%|██████████| 1/1 [00:00<00:00, 2.07it/s]
INFO:hydropandas.io.waterinfo.get_measurements_ddlpy:No measurements for locatie='schoonhoven', grootheid_code='70%_L', groepering_code='LEVDHD5', parameter_code='NVT' and proces_type='meting' between 2020-01-01 00:00:00 and 2020-01-03 00:00:00
100%|██████████| 1/1 [00:00<00:00, 2.04it/s]
INFO:hydropandas.io.waterinfo.get_measurements_ddlpy:No measurements for locatie='schoonhoven', grootheid_code='NVT', groepering_code='LEVDHD5', parameter_code='NVT' and proces_type='meting' between 2020-01-01 00:00:00 and 2020-01-03 00:00:00
100%|██████████| 1/1 [00:00<00:00, 2.05it/s]
INFO:hydropandas.io.waterinfo.get_measurements_ddlpy:No measurements for locatie='schoonhoven', grootheid_code='HOOGWTDG', groepering_code='', parameter_code='NVT' and proces_type='meting' between 2020-01-01 00:00:00 and 2020-01-03 00:00:00
100%|██████████| 1/1 [00:00<00:00, 2.17it/s]
INFO:hydropandas.io.waterinfo.get_measurements_ddlpy:No measurements for locatie='schoonhoven', grootheid_code='NVT', groepering_code='', parameter_code='NVT' and proces_type='meting' between 2020-01-01 00:00:00 and 2020-01-03 00:00:00
100%|██████████| 1/1 [00:00<00:00, 2.16it/s]
INFO:hydropandas.io.waterinfo.get_measurements_ddlpy:No measurements for locatie='schoonhoven', grootheid_code='80%_L', groepering_code='LEVDHD5', parameter_code='NVT' and proces_type='meting' between 2020-01-01 00:00:00 and 2020-01-03 00:00:00
100%|██████████| 1/1 [00:00<00:00,  2.08it/s]
100%|██████████| 1/1 [00:00<00:00,  1.45it/s]
100%|██████████| 1/1 [00:00<00:00,  2.14it/s]
100%|██████████| 1/1 [00:00<00:00,  2.16it/s]
INFO:hydropandas.io.waterinfo.get_measurements_ddlpy:No measurements for locatie='schoonhoven', grootheid_code='50%_L', groepering_code='LEVDHD5', parameter_code='NVT' and proces_type='meting' between 2020-01-01 00:00:00 and 2020-01-03 00:00:00
100%|██████████| 1/1 [00:00<00:00, 2.18it/s]
INFO:hydropandas.io.waterinfo.get_measurements_ddlpy:No measurements for locatie='schoonhoven', grootheid_code='HOOGWTNT', groepering_code='', parameter_code='NVT' and proces_type='meting' between 2020-01-01 00:00:00 and 2020-01-03 00:00:00
[3]:
| x | y | location | filename | source | unit | metadata_available | obs | |
|---|---|---|---|---|---|---|---|---|
| name | ||||||||
| Schoonhoven Waterhoogte | 118061.727238 | 439419.244069 | Schoonhoven | waterinfo (ddlpy) | cm NAP | NaN | WaterlvlObs Schoonhoven Waterhoogte -----metad... | |
| Schoonhoven Waterhoogte (1) | 118061.727238 | 439419.244069 | Schoonhoven | waterinfo (ddlpy) | cm NAP | NaN | WaterlvlObs Schoonhoven Waterhoogte (1) -----m... | |
| Schoonhoven NVT | 118061.727238 | 439419.244069 | Schoonhoven | waterinfo (ddlpy) | DIMSLS | NaN | WaterlvlObs Schoonhoven NVT -----metadata-----... |
[4]:
# show all measurement types within the extent
gdf_meas = get_locations_gdf()
gdf_meas.loc[
    locatie,
    [
        "Grootheid.Code",
        "Grootheid.Omschrijving",
        "Groepering.Code",
        "Groepering.Omschrijving",
        "Parameter.Code",
        "Parameter.Omschrijving",
        "ProcesType",
    ],
]
INFO:ddlpy.ddlpy.retrieve_or_load_catalog:Loading Waterwebservices catalog from cache
[4]:
| Grootheid.Code | Grootheid.Omschrijving | Groepering.Code | Groepering.Omschrijving | Parameter.Code | Parameter.Omschrijving | ProcesType | |
|---|---|---|---|---|---|---|---|
| Code | |||||||
| schoonhoven | LAAGWTDG | Laagwater dag | NVT | NVT | meting | ||
| schoonhoven | 90%_L | 90 percentiel van de levendigheid | LEVDHD5 | Levendigheid | NVT | NVT | meting |
| schoonhoven | WATHTE | Waterhoogte | NVT | NVT | verwachting | ||
| schoonhoven | 70%_L | 70 percentiel van de levendigheid | LEVDHD5 | Levendigheid | NVT | NVT | meting |
| schoonhoven | NVT | NVT | LEVDHD5 | Levendigheid | NVT | NVT | meting |
| schoonhoven | HOOGWTDG | Hoogwater dag | NVT | NVT | meting | ||
| schoonhoven | WATHTE | Waterhoogte | NVT | NVT | astronomisch | ||
| schoonhoven | NVT | NVT | NVT | NVT | meting | ||
| schoonhoven | NVT | NVT | GETETBRKD2 | Getijextreem berekend | NVT | NVT | astronomisch |
| schoonhoven | 80%_L | 80 percentiel van de levendigheid | LEVDHD5 | Levendigheid | NVT | NVT | meting |
| schoonhoven | WATHTE | Waterhoogte | GETETM2 | Getijextremen | NVT | NVT | meting |
| schoonhoven | WATHTE | Waterhoogte | NVT | NVT | meting | ||
| schoonhoven | NVT | NVT | GETETM2 | Getijextremen | NVT | NVT | meting |
| schoonhoven | 50%_L | 50 percentiel van de levendigheid | LEVDHD5 | Levendigheid | NVT | NVT | meting |
| schoonhoven | HOOGWTNT | Hoogwater nacht | NVT | NVT | meting | ||
| schoonhoven | WATHTE | Waterhoogte | GETETBRKD2 | Getijextreem berekend | NVT | NVT | astronomisch |
[5]:
# get data from a certain location and grootheid
o1 = hpd.WaterlvlObs.from_waterinfo(
    locatie="schoonhoven",
    grootheid_code="WATHTE",
    groepering_code="",
    proces_type="meting",
    tmin=tmin,
    tmax=tmax,
    location_gdf=gdf_meas,  # specifying the location_gdf signficantly speeds up the process
)
o1
100%|██████████| 1/1 [00:00<00:00, 1.45it/s]
[5]:
hydropandas.WaterlvlObs
| Schoonhoven Waterhoogte | |
|---|---|
| x | 118061.727238 |
| y | 439419.244069 |
| location | Schoonhoven |
| filename | |
| source | waterinfo (ddlpy) |
| unit | cm NAP |
| metadata_available | NaN |
| value | |
|---|---|
| time | |
| 2020-01-01 01:00:00 | 52.0 |
| 2020-01-01 01:10:00 | 49.0 |
| 2020-01-01 01:20:00 | 47.0 |
| 2020-01-01 01:30:00 | 44.0 |
| 2020-01-01 01:40:00 | 42.0 |
| ... | ... |
| 2020-01-03 00:20:00 | 90.0 |
| 2020-01-03 00:30:00 | 88.0 |
| 2020-01-03 00:40:00 | 85.0 |
| 2020-01-03 00:50:00 | 83.0 |
| 2020-01-03 01:00:00 | 81.0 |
289 rows × 1 columns
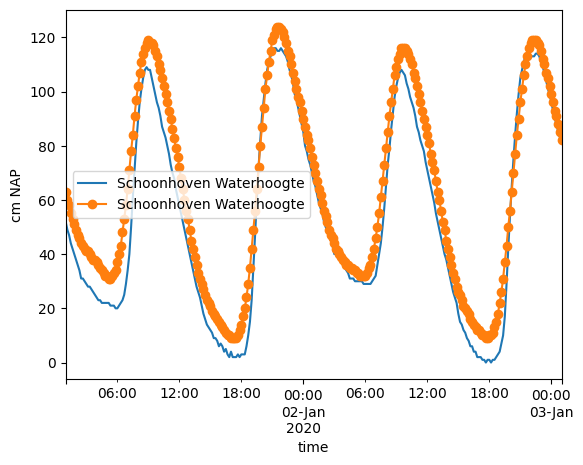
[6]:
# get data from a certain location and grootheid
o2 = hpd.WaterlvlObs.from_waterinfo(
    locatie="schoonhoven",
    grootheid_code="WATHTE",
    groepering_code="",
    proces_type="astronomisch",
    tmin=tmin,
    tmax=tmax,
    location_gdf=gdf_meas,  # specifying the location_gdf signficantly speeds up the process
)

# plot data
ax = o1["value"].plot(ylabel=o1.unit, label=o1.name, legend=True)
o2["value"].plot(ylabel=o2.unit, label=o2.name, marker="o", legend=True, ax=ax);
100%|██████████| 1/1 [00:00<00:00, 1.47it/s]
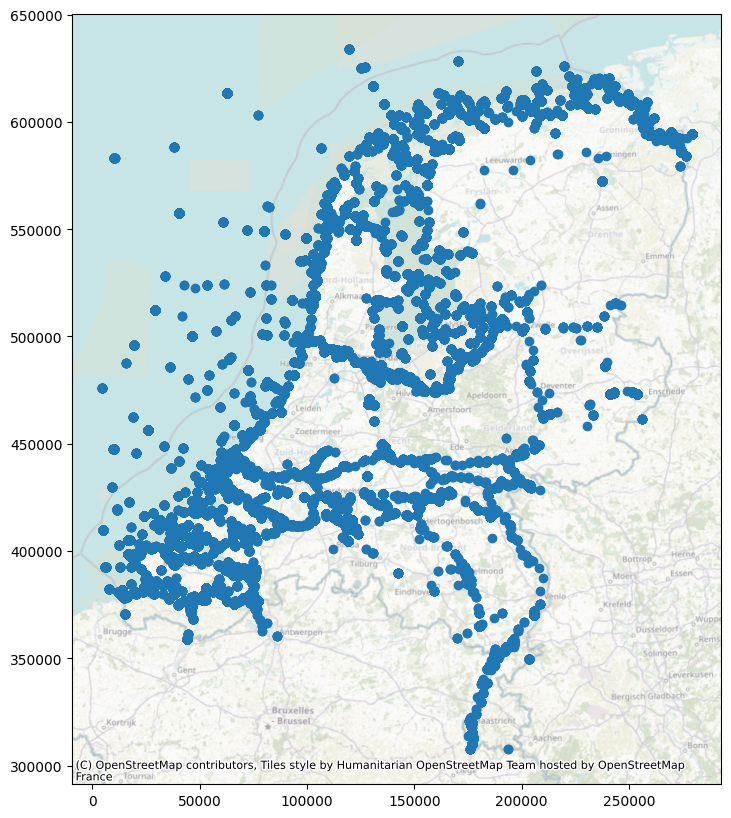
[7]:
# get all measurement points within the Netherlands
gdf = hpd.io.waterinfo.get_locations_gdf()
gdf = hpd.io.waterinfo.get_locations_within_extent(
    gdf, extent=(482.06, 306602.42, 284182.97, 637049.52)
)
ax = gdf.plot(figsize=(10, 10))
ctx.add_basemap(ax=ax, crs=28992, alpha=0.5)
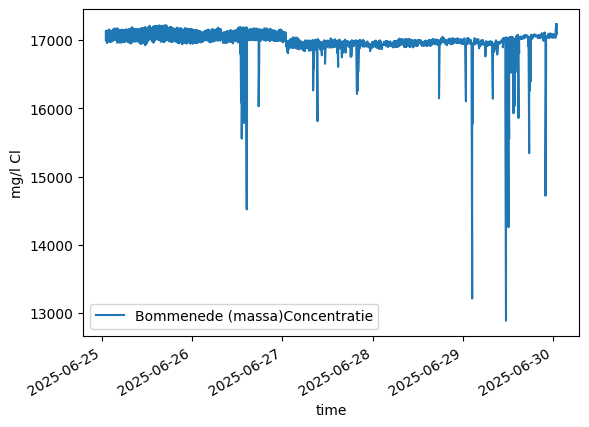
Water quality data
The Waterinfo database also contains water quality data
[8]:
# get chloride concentration from the Oosterschelde (Bommenede 1 (b))
o_cl = hpd.WaterlvlObs.from_waterinfo(
    locatie="bommenede",
    parameter_code="Cl",
    tmin="2025-6-25",
    tmax="2025-6-30",
    location_gdf=gdf,
)

# plot data
ax = o_cl["value"].plot(ylabel=o_cl.unit, label=o_cl.name, legend=True)
INFO:hydropandas.io.waterinfo.get_measurements_ddlpy:Multiple observation points match critera, select first one with measurements
100%|██████████| 1/1 [00:01<00:00, 1.15s/it]
Or download all chloride measurements within a certain extent
[9]:
oc = hpd.read_waterinfo(
    extent=(80000, 90000, 429550, 449900),
    parameter_code="Cl",
    tmin="2025-6-1",
    tmax="2025-6-10",
)
oc.plots.interactive_map(popup_width=350)
INFO:hydropandas.io.waterinfo.get_obs_list_from_extent:downloading waterinfo measurements from 8 observation points
100%|██████████| 1/1 [00:01<00:00,  1.89s/it]
100%|██████████| 1/1 [00:00<00:00,  2.14it/s]
INFO:hydropandas.io.waterinfo.get_measurements_ddlpy:No measurements for locatie='hoogvliet', grootheid_code='CONCTTE', groepering_code='', parameter_code='Cl' and proces_type='meting' between 2025-06-01 00:00:00 and 2025-06-10 00:00:00
100%|██████████| 1/1 [00:00<00:00, 2.17it/s]
INFO:hydropandas.io.waterinfo.get_measurements_ddlpy:No measurements for locatie='vlaardingen', grootheid_code='CONCTTE', groepering_code='', parameter_code='Cl' and proces_type='meting' between 2025-06-01 00:00:00 and 2025-06-10 00:00:00
100%|██████████| 1/1 [00:00<00:00, 2.18it/s]
INFO:hydropandas.io.waterinfo.get_measurements_ddlpy:No measurements for locatie='rotterdam.lekhaven', grootheid_code='CONCTTE', groepering_code='', parameter_code='Cl' and proces_type='meting' between 2025-06-01 00:00:00 and 2025-06-10 00:00:00
100%|██████████| 1/1 [00:01<00:00,  1.83s/it]
100%|██████████| 1/1 [00:00<00:00,  2.18it/s]
INFO:hydropandas.io.waterinfo.get_measurements_ddlpy:No measurements for locatie='spijkenisse.oudemaas.brug', grootheid_code='CONCTTE', groepering_code='', parameter_code='Cl' and proces_type='meting' between 2025-06-01 00:00:00 and 2025-06-10 00:00:00
100%|██████████| 1/1 [00:00<00:00, 2.20it/s]
INFO:hydropandas.io.waterinfo.get_measurements_ddlpy:No measurements for locatie='pernis', grootheid_code='CONCTTE', groepering_code='', parameter_code='Cl' and proces_type='meting' between 2025-06-01 00:00:00 and 2025-06-10 00:00:00
100%|██████████| 1/1 [00:00<00:00, 2.14it/s]
INFO:hydropandas.io.waterinfo.get_measurements_ddlpy:No measurements for locatie='europoort.hartelkering', grootheid_code='CONCTTE', groepering_code='', parameter_code='Cl' and proces_type='meting' between 2025-06-01 00:00:00 and 2025-06-10 00:00:00
[9]:
Find selection criteria
Very often you don’t know exactly the names of the location, grootheid_code, groepering_code or parameter_code. To get the data that you want you can follow these steps:
get a geodataframe with all the locations in the extent
query the geodataframe to find either a location/grootheid_code/groepering_code or parameter_code
call
read_waterinfowith your selection criteria and a tmin and tmax value
[10]:
# 1 download geodataframe with all measurement points in your extent
gdf = hpd.io.waterinfo.get_locations_gdf()
gdf_locatie = hpd.io.waterinfo.get_locations_within_extent(
    gdf, extent=(80000, 90000, 429550, 449900)
)
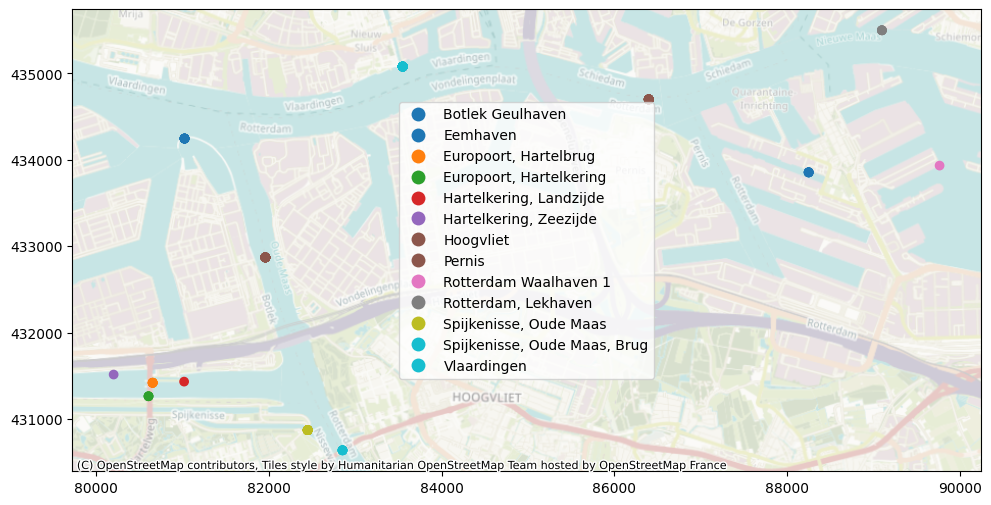
[11]:
# 2 query the GeoDataFrame

# print unique names
print(f"Unique values of Grootheid Code: \n{gdf_locatie['Grootheid.Code'].unique()}\n")
print(
    f"Unique values of Groepering Code: \n{gdf_locatie['Groepering.Code'].unique()}\n"
)
print(f"Unique values of Parameter Code: \n{gdf_locatie['Parameter.Code'].unique()}\n")
print(f"Unique values of Proces Type: \n{gdf_locatie['ProcesType'].unique()}\n")

# plot locations
ax = gdf_locatie.plot("Naam", figsize=(16, 6), legend=True)
ctx.add_basemap(ax=ax, crs=28992, alpha=0.5)
Unique values of Grootheid Code:
['WATHTE' 'CONCTTE' 'GELDHD' 'T' 'NVT' '50%_L' 'VOLMFTE' 'SALNTT'
 'WINDSHD' 'PMV' 'VERZDGGD' 'LAAGWTDG' 'pH' '80%_L' 'STROOMSHD' 'MASSFTE'
 'WATOZT' 'HOOGWTDG' 'ZICHT' 'WINDRTG' '70%_L' '90%_L' 'HOOGWTNT']

Unique values of Groepering Code:
['' 'GETETM2' 'LEVDHD5' 'GETETBRKD2' 'GETETOZBRKD2']

Unique values of Parameter Code:
['NVT' 'OS' 'Ptot' 'O2' 'CHLFa' 'GR' 'PO4' 'sMBAS' 'sPO4' 'F' 'SiO2'
 'sNO3NO2' 'FolINDX' 'NKj' 'Cl' 'minrlole' 'NH4' 'BZV5a' 'TOC' 'NO2' 'SO4']

Unique values of Proces Type:
['astronomisch' 'meting' 'verwachting']
[12]:
# 3 read data for selection criteria
oc = hpd.read_waterinfo(
    parameter_code="Cl", tmin="2025-6-1", tmax="2025-6-10", location_gdf=gdf_locatie
)
oc
INFO:hydropandas.io.waterinfo.get_obs_list_from_extent:downloading waterinfo measurements from 8 observation points
100%|██████████| 1/1 [00:01<00:00,  1.88s/it]
100%|██████████| 1/1 [00:00<00:00,  2.05it/s]
INFO:hydropandas.io.waterinfo.get_measurements_ddlpy:No measurements for locatie='hoogvliet', grootheid_code='CONCTTE', groepering_code='', parameter_code='Cl' and proces_type='meting' between 2025-06-01 00:00:00 and 2025-06-10 00:00:00
100%|██████████| 1/1 [00:00<00:00, 2.04it/s]
INFO:hydropandas.io.waterinfo.get_measurements_ddlpy:No measurements for locatie='vlaardingen', grootheid_code='CONCTTE', groepering_code='', parameter_code='Cl' and proces_type='meting' between 2025-06-01 00:00:00 and 2025-06-10 00:00:00
100%|██████████| 1/1 [00:00<00:00, 2.03it/s]
INFO:hydropandas.io.waterinfo.get_measurements_ddlpy:No measurements for locatie='rotterdam.lekhaven', grootheid_code='CONCTTE', groepering_code='', parameter_code='Cl' and proces_type='meting' between 2025-06-01 00:00:00 and 2025-06-10 00:00:00
100%|██████████| 1/1 [00:01<00:00,  1.87s/it]
100%|██████████| 1/1 [00:00<00:00,  2.12it/s]
INFO:hydropandas.io.waterinfo.get_measurements_ddlpy:No measurements for locatie='spijkenisse.oudemaas.brug', grootheid_code='CONCTTE', groepering_code='', parameter_code='Cl' and proces_type='meting' between 2025-06-01 00:00:00 and 2025-06-10 00:00:00
100%|██████████| 1/1 [00:00<00:00, 2.15it/s]
INFO:hydropandas.io.waterinfo.get_measurements_ddlpy:No measurements for locatie='pernis', grootheid_code='CONCTTE', groepering_code='', parameter_code='Cl' and proces_type='meting' between 2025-06-01 00:00:00 and 2025-06-10 00:00:00
100%|██████████| 1/1 [00:00<00:00, 2.17it/s]
INFO:hydropandas.io.waterinfo.get_measurements_ddlpy:No measurements for locatie='europoort.hartelkering', grootheid_code='CONCTTE', groepering_code='', parameter_code='Cl' and proces_type='meting' between 2025-06-01 00:00:00 and 2025-06-10 00:00:00
[12]:
| x | y | location | filename | source | unit | metadata_available | obs | |
|---|---|---|---|---|---|---|---|---|
| name | ||||||||
| Rotterdam, Lekhaven (massa)Concentratie | 89100.000511 | 435500.053282 | Rotterdam, Lekhaven | waterinfo (ddlpy) | mg/l Cl | NaN | WaterlvlObs Rotterdam, Lekhaven (massa)Concent... | |
| Spijkenisse, Oude Maas, Brug (massa)Concentratie | 82853.508202 | 430636.140691 | Spijkenisse, Oude Maas, Brug | waterinfo (ddlpy) | mg/l Cl | NaN | WaterlvlObs Spijkenisse, Oude Maas, Brug (mass... |
Retrieving data from WaterWebservices
In the future, the WaterWebservices will become available. Currently (2024-03-20), they are not yet working. When retrieving measurements, it is always indicated that the maximum number of measurements is exceeded. Even when retrieving measurements for only one day.
Useful information:
https://waterwebservices.beta.rijkswaterstaat.nl/test/swagger-ui/index.html#/
https://rijkswaterstaatdata.nl/projecten/beta-waterwebservices/
[13]:
# import json

# import requests
# from shapely.geometry import Point

# import nlmod
[14]:
# # request catalogus REST API
# url = "https://waterwebservices.beta.rijkswaterstaat.nl/test/METADATASERVICES/OphalenCatalogus"
# body = {"CatalogusFilter": {"Compartimenten": True, "Grootheden": True}}
# headers = {"content-type": "application/json"}
# r = requests.post(url, data=json.dumps(body), headers=headers)

# out = r.json()
[15]:
# # plot locations from REST API
# geometries = [Point(loc["Lon"], loc["Lat"]) for loc in out["LocatieLijst"]]
# gdf = gpd.GeoDataFrame(out["LocatieLijst"], geometry=geometries, crs=4258)
# gdf.to_crs(28992, inplace=True)
# # extent_nl_poly = nlmod.util.extent_to_polygon(
#     [482.06, 306602.42, 284182.97, 637049.52]
# )
# gdf = gdf.loc[gdf.within(extent_nl_poly)]
# ax = gdf.plot(figsize=(10, 10))
# nlmod.plot.add_background_map(ax=ax)
[16]:
# read REST API using an extent (Schoonhoven zuid-west)
# extent_schoon = nlmod.util.polygon_from_extent((117850, 118180, 439550, 439900))
# gdf_schoon = gdf.loc[gdf.within(extent_schoon.buffer(10000))]
# ax = gdf_schoon.plot("Code", figsize=(10, 10), legend=True)
# nlmod.plot.add_background_map(ax=ax, alpha=0.5)
[17]:
# # kies code en laat zien welke parameters erbij horen
# code = "schoonhoven"

# df_meta_locatie = pd.DataFrame(out["AquoMetadataLocatieLijst"]).set_index(
#     "Locatie_MessageID"
# )
# df_meta = pd.DataFrame(out["AquoMetadataLijst"])

# locatie_message_id = gdf.loc[gdf["Code"] == code, "Locatie_MessageID"].iloc[0]

# AquoMetaData_MessageIDs = df_meta_locatie.loc[
#     locatie_message_id, "AquoMetaData_MessageID"
# ]
# if isinstance(AquoMetaData_MessageIDs, int):
#     AquoMetaData_MessageIDs = [AquoMetaData_MessageIDs]
# df_meta.loc[AquoMetaData_MessageIDs]
[18]:
# # request om metingen op te halen
# code = "ameland.nes"
# aquometadata_message_id = 6

# url = "https://waterwebservices.beta.rijkswaterstaat.nl/test/ONLINEWAARNEMINGENSERVICES/OphalenWaarnemingen"
# body = {
#     "Locatie": {"Code": code},
#     "AquoPlusWaarnemingMetadata": {
#         "AquoMetadata": {
#             "Compartiment": {
#                 "Code": df_meta.loc[aquometadata_message_id, "Compartiment"]["Code"]
#             },
#             "Grootheid": {
#                 "Code": df_meta.loc[aquometadata_message_id, "Grootheid"]["Code"]
#             },
#         }
#     },
#     "Periode": {
#         "Begindatumtijd": "2024-06-01T00:00:00.000+01:00",
#         "Einddatumtijd": "2025-01-01T00:00:00.000+01:00",
#     },
# }
# headers = {"content-type": "application/json"}
# r = requests.post(url, data=json.dumps(body), headers=headers)
# if r.status_code == 204:
#     print("No data available")
# else:
#     meas = r.json()
#     print(meas)
[19]:
# # andere poging
# code = "ameland.nes"
# aquometadata_message_id = 6

# url = "https://waterwebservices.beta.rijkswaterstaat.nl/test/ONLINEWAARNEMINGENSERVICES/OphalenWaarnemingen"
# body = {
#     "Locatie": {"Code": code},
#     "AquoPlusWaarnemingMetadata": {
#         "AquoMetadata": {
#             "ProcesType": "verwachting",
#             "Grootheid": {
#                 "Code": df_meta.loc[aquometadata_message_id, "Grootheid"]["Code"]
#             },
#         }
#     },
#     "Periode": {
#         "Begindatumtijd": "2024-01-01T00:00:00.000+01:00",
#         "Einddatumtijd": "2024-01-02T00:00:00.000+01:00",
#     },
# }
# headers = {"content-type": "application/json"}
# r = requests.post(url, data=json.dumps(body), headers=headers)
# if r.status_code == 204:
#     print("No data available")
# else:
#     meas = r.json()
#     print(meas)
[ ]: